Independent Board Advisory, Executive Education and Professional Speaking

Liquidity Trumps Fundamentals as Singapore's Market Delivers Best Returns in a Decade
The Edge Singapore featured my article "Liquidity Trumps Fundamentals as Singapore's Market Delivers Best Returns in a Decade" on 16 February 2026.
Lee Ooi Keong
2/24/202610 min read
Liquidity Trumps Fundamentals as Singapore's Market Delivers Best Returns in a Decade
TLDR version. Full version.
The Headline Performance
Singapore’s equity market had its best year in more than a decade. The Straits Times Index (STI) rose 22.7% in 2025, delivering a 28.6% total return including dividends, its strongest annual performance in at least a decade, according to FTSE Russell. The iEdge Singapore Next 50 index (NTR) broadly matched that outcome, posting about 26% price appreciation and 28.5% on a total return basis.
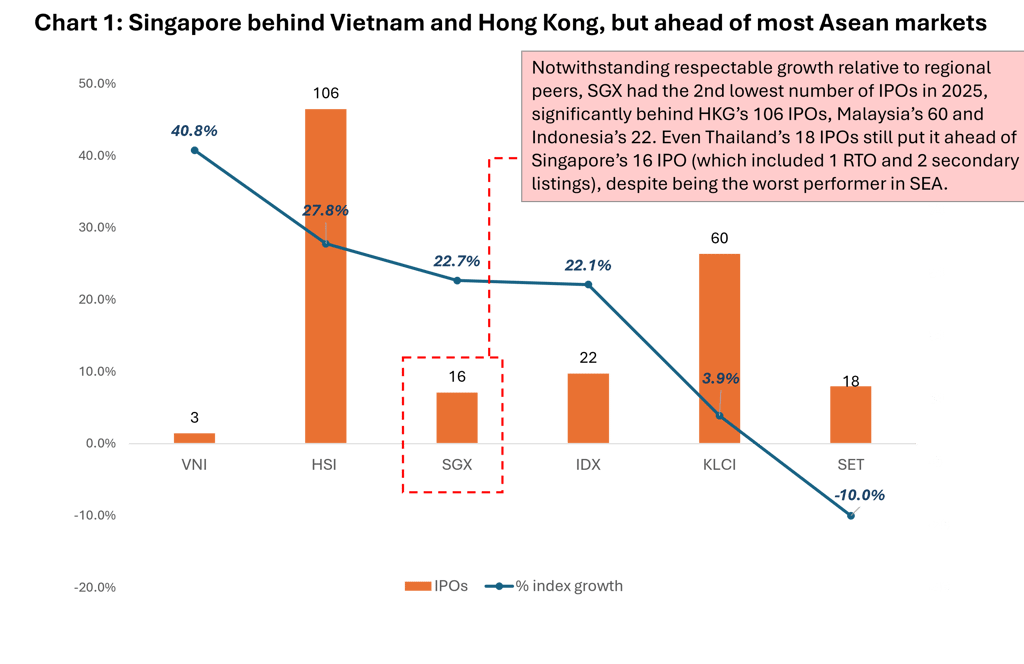
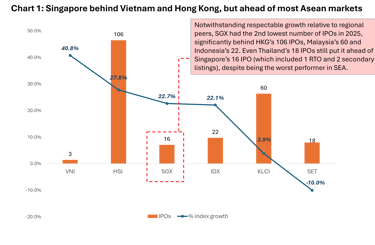
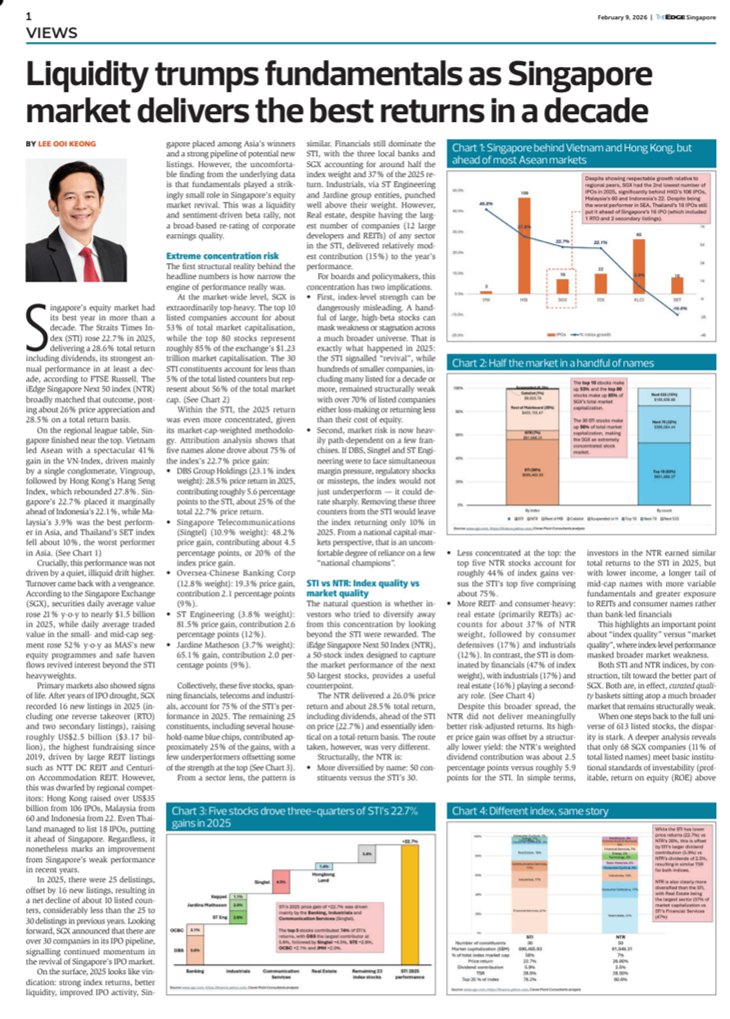
On the regional league table, Singapore finished near the top. Vietnam led ASEAN with a spectacular 41% gain in the VN‑Index, driven mainly by a single conglomerate, Vingroup, followed by Hong Kong’s Hang Seng Index which rebounded 27.8%. Singapore’s 22.7% placed it marginally ahead of Indonesia’s 22.1%, while Malaysia managed 3.9% for the calendar year and Thailand’s SET index fell about 10%, the worst performer in Asia. (See Chart 1).
Crucially, this performance was not driven by a quiet, illiquid drift higher. Turnover came back with a vengeance. According to SGX, securities daily average value rose 21% year‑on‑year to nearly S$1.5 billion in 2025, while daily average traded value in the small‑ and mid‑cap segment rose 52% year‑on‑year as MAS’s new equity programmes and safe haven flows revived interest beyond the STI heavyweights.
Primary markets also showed signs of life. After years of IPO drought, SGX recorded 16 new listings in 2025 (including 1 RTO and 2 secondary listings), raising roughly US$2.5 billion, the highest fundraising since 2019, driven by large REIT listings such as NTT DC REIT and Centurion Accommodation REIT. However, this was dwarfed by regional competitors; Hong Kong raised over US$35 billion from 106 IPOs, Malaysia delivered 60 IPOs and Indonesia 22 IPOs. Even Thailand managed to list 18 IPOs, putting it ahead of Singapore. Regardless, it nonetheless marks an improvement from Singapore’s weak performance in recent years.
In 2025, there were 25 delistings, offsetting the 16 new listings, resulting in a net decline of listed counters by about 10 names, considerably lesser than the 25 to 30 delistings in previous years. Looking forward, SGX announced that there are over 30 companies in their IPO pipeline, signalling continued momentum in the revival of Singapore’s IPO market.
On the surface then, 2025 looks like vindication: strong index returns, better liquidity, improved IPO activity, Singapore placed among Asia’s winners and a strong pipeline of potential new listings. However, the uncomfortable finding from the underlying data is that fundamentals played a strikingly small role in Singapore’s equity market revival. This was a liquidity and sentiment‑driven beta rally, not a broad‑based re-rating of corporate earnings quality.
Extreme Concentration Risk
The first structural reality behind the headline numbers is how narrow the engine of performance really was.
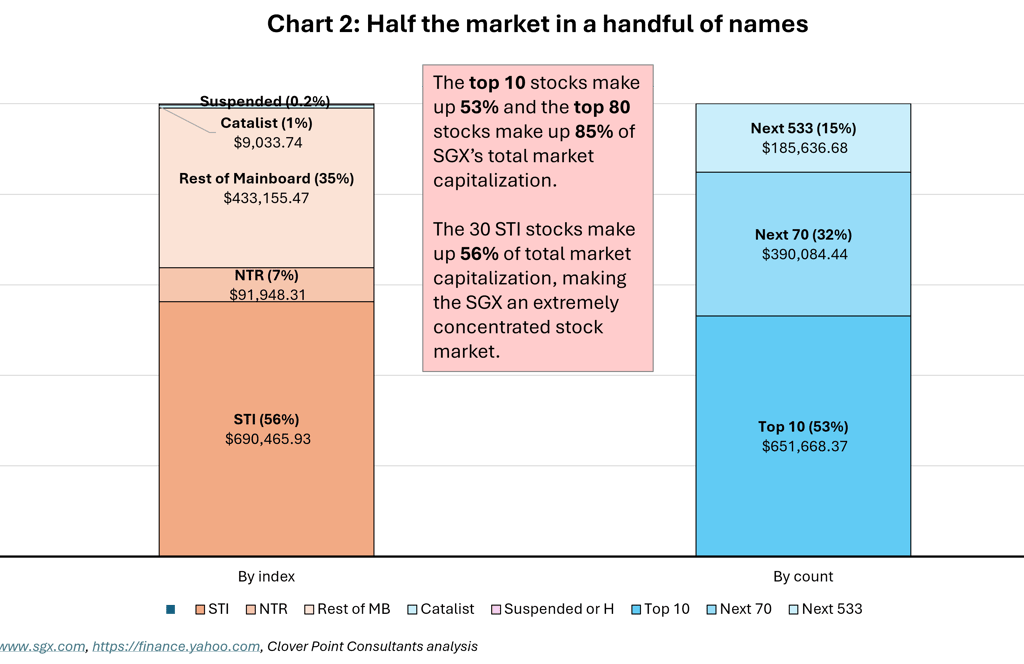
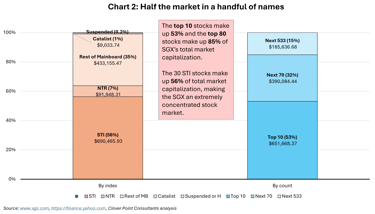
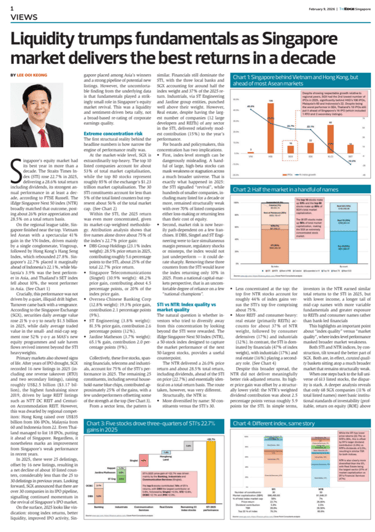
At the market‑wide level, SGX is extraordinarily top‑heavy. The top 10 listed companies account for about 53% of total market capitalisation, while the top 80 stocks represent roughly 85% of the exchange’s S$1.23 trillion market capitalization. The 30 STI constituents (less than 5% of total listed counters) alone represent about 56% of total market cap. (See Chart 2)
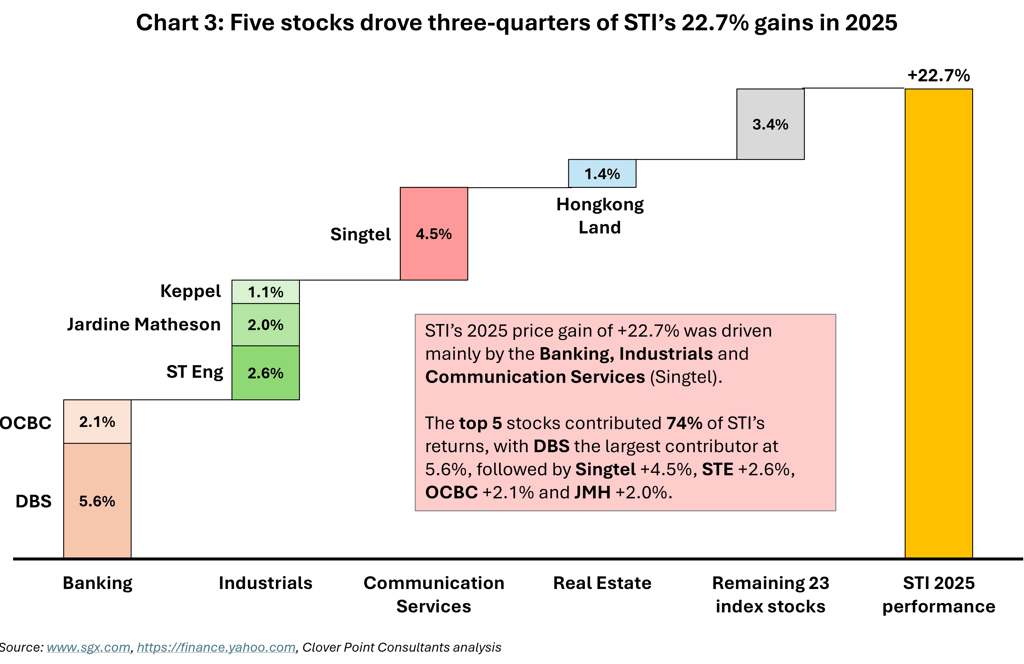
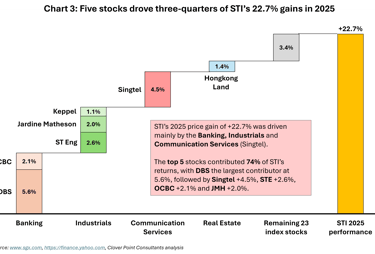
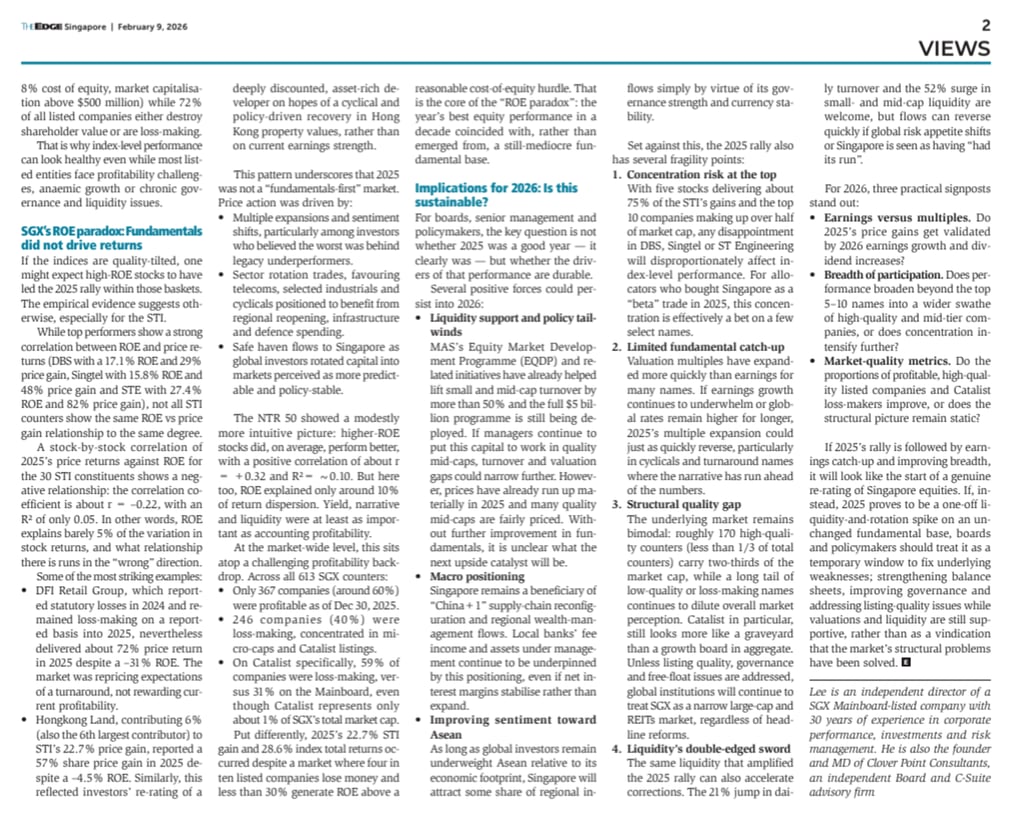
Within the STI, 2025’s return was even more concentrated, given its market cap-weighted methodology. Attribution analysis shows that five names alone drove about 75% of the index’s 22.7% price gain:
DBS Group (23.1% index weight): 28.5% price return in 2025, contributing roughly 5.6 percentage points to the STI, about 25% of the total 22.7% price return.
Singtel (10.9% weight): 48.2% price gain, contributing about 4.5 percentage points, or 20% of the index price gain.
OCBC (12.8% weight): 19.3% price gain, contribution 2.1 percentage points (9%).
ST Engineering (3.8% weight): 81.5% price gain, contribution 2.6 percentage points (12%).
Jardine Matheson (3.7% weight): 65.1% gain, contribution 2.0 percentage points (9%).
Collectively, these five stocks, spanning financials, telecoms and industrials, explain 75% of the STI’s performance in 2025. The remaining 25 constituents, including several household‑name blue chips, effectively contributed the remainder ~25% of gains, with a few underperformers offsetting some of the strength at the top (See Chart 3).
From a sector lens, the pattern is similar. Financials still dominate the STI, with the three local banks and SGX accounting for around half the index weight and 37% of the 2025 return. Industrials, via ST Engineering and Jardine group entities, punched well above their weight. However, Real estate, despite having the largest number of companies (12 large developers and REITs) of any sector in the STI, delivered relatively modest contribution (15%) to the year’s performance.
For boards and policymakers, this concentration has two implications.
First, index‑level strength can be dangerously misleading. A handful of large, high‑beta stocks can mask weakness or stagnation across a much broader universe. That is exactly what happened in 2025: the STI signalled “revival”, while hundreds of smaller companies, including many listed for a decade or more, remained structurally weak with over 70% of listed companies either loss-making or returning less than their Cost of Equity.
Second, market risk is now heavily path‑dependent on a few franchises. If DBS, Singtel and STE were to face simultaneous margin pressure, regulatory shocks or missteps, the index would not just underperform – it could de‑rate sharply. Remove these three counters from the STI and the index returns only 10% in 2025! From a national capital‑markets perspective, that is an uncomfortable degree of reliance on a few ‘national champions’.
STI vs NTR: Index Quality vs Market Quality
The natural question is whether investors who tried to diversify away from this concentration by looking beyond the STI were rewarded. The iEdge Singapore Next 50 Index (NTR), a 50‑stock index designed to capture the market performance of the next 50-largest stocks, provides a useful counterpoint.
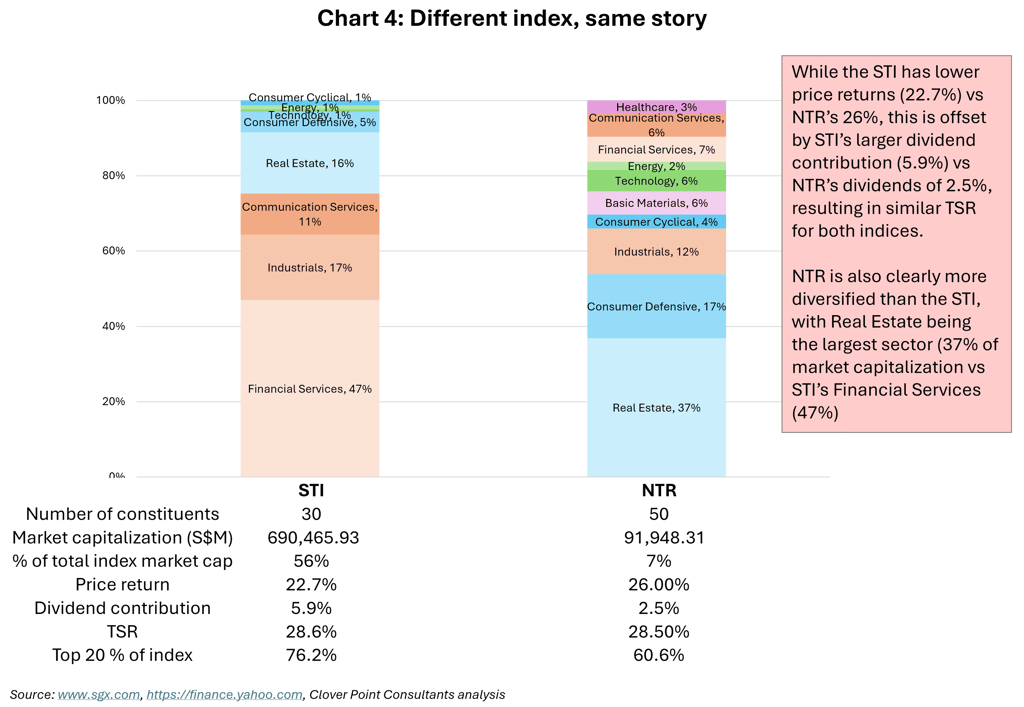
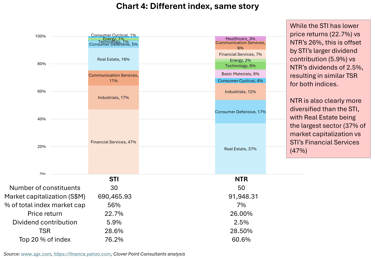
The NTR delivered a 26.0% price return and about 28.5% total return once dividends are included, ahead of the STI on price (22.7%) and essentially identical on a total‑return basis. The route taken, however, was very different.
Structurally, the NTR is:
More diversified by name: 50 constituents versus the STI’s 30.
Less concentrated at the top: the top 5 NTR stocks account for roughly 44% of index gains versus the STI’s top 5 comprising about 75%.
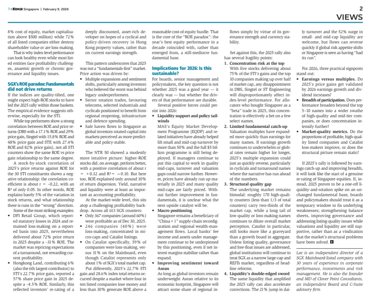
More REIT‑ and consumer‑heavy: real estate (primarily REITs) represents around 37% of NTR weight, followed by consumer defensives (17%) and industrials (12%). In contrast, the STI is dominated by financials (47% of index weight), with industrials (17%) and real estate (16%) playing a secondary role (See Chart 4).
Despite this broader spread, the NTR did not deliver meaningfully better risk‑adjusted returns. Its higher price gain was offset by a structurally lower yield: the NTR’s weighted dividend contribution was about 2.5 percentage points versus roughly 5.9 points for the STI. In simple terms, investors in the NTR earned similar total returns to the STI in 2025, but with lower income, a longer tail of mid‑cap names with more variable fundamentals and greater exposure to REITs and consumer names rather than bank‑led financials
This highlights an important point about “index quality” versus “market quality”, where index-level performance masked broader market weakness.
Both STI and NTR indices, by construction, tilt toward the better part of SGX. Both are, in effect, curated quality baskets sitting atop a much broader market that remains structurally weak.
When one steps back to the full universe of 613 listed stocks, the disparity is stark. A deeper analysis reveals that only 68 SGX companies (11% of total listed names) meet basic institutional standards of investability (profitable, ROE above 8% Cost of Equity, market capitalization above S$500M) while 72% of all listed companies either destroy shareholder value or are loss-making.
That is why index‑level performance can look healthy even while most listed entities face profitability challenges, anaemic growth or chronic governance and liquidity issues.
SGX’s ROE Paradox: Fundamentals Didn’t Drive Returns
If the indices are quality‑tilted, one might expect high‑ROE stocks to have led the 2025 rally within those baskets. The empirical evidence suggests otherwise, especially for the STI.
While top performers show strong correlation between ROE and price returns (DBS with a 17.1% ROE and 29% price gain, Singtel with 15.8% ROE and 48% price gain and STE with 27.4% ROE and 82% price gain), not all STI counters show the same ROE vs price gain relationship to the same degree.
A stock‑by‑stock correlation of 2025’s price returns against return on equity (ROE) for the 30 STI constituents shows a negative relationship: the correlation coefficient is about r = –0.22, with an R² of only 0.05. In other words, ROE explains barely 5% of the variation in stock returns, and what relationship there is runs in the “wrong” direction.
Some of the most striking examples:
DFI Retail Group, which reported statutory losses in 2024 and remained loss‑making on a reported basis into 2025, nevertheless delivered about 72% price return in 2025 despite a -31% ROE. The market was repricing expectations of a turnaround, not rewarding current profitability.
Hongkong Land, contributing 6% (also the 6th largest contributor) to STI’s 22.7% price gain, reported a 57% share price gain in 2025 despite a -4.5% ROE. Similarly, this reflected investors re‑rating a deeply discounted, asset‑rich developer on hopes of a cyclical and policy‑driven recovery in Hong Kong property values rather than rewarding current earnings strength.
This pattern underscores that 2025 was not a “fundamentals‑first” market. Price action was driven by:
Multiple expansion and sentiment shifts, particularly where investors believed the worst was behind legacy underperformers.
Sector rotation trades, favouring telecoms, selected industrials and cyclicals positioned to benefit from regional reopening, infrastructure and defence spending.
Safe haven flows to Singapore as global investors rotated capital into markets perceived as more predictable and policy‑stable.
The NTR 50 showed a modestly more intuitive picture: higher‑ROE stocks did, on average, perform better, with a positive correlation of about r = +0.32 and R² ~0.10. But here too, ROE explained only around 10% of return dispersion. Yield, narrative and liquidity were at least as important as accounting profitability.
At the market‑wide level, this sits atop a challenging profitability backdrop. Across all 613 SGX counters:
Only 367 companies (around 60%) were profitable as of 30 December 2025.
246 companies (40%) were loss‑making, concentrated in micro‑caps and Catalist listings.
On Catalist specifically, 59% of companies were loss‑making, versus 31% on the Mainboard, even though Catalist represents only about 1% of SGX’s total market cap.
Put differently, 2025’s 22.7% STI gain and 28.6% index total returns occurred despite a market where four in ten listed companies lose money and less than 30% generate ROE above a reasonable cost‑of‑equity hurdle. That is the core of the “ROE paradox”: the year’s best equity performance in a decade coincided with, rather than emerged from, a still‑mediocre fundamental base.
Implications for 2026: Is This Sustainable?
For boards, senior management and policymakers, the key question is not whether 2025 was a good year – it clearly was – but whether the drivers of that performance are durable.
Several positive forces could persist into 2026:
Liquidity support and policy tailwinds.
MAS’s Equity Market Development Programme (EQDP) and related initiatives have already helped lift small and mid‑cap turnover by more than 50%, and the full S$5 billion programme is still being deployed. If managers continue to put this capital to work in quality mid‑caps, turnover and valuation gaps could narrow further. However, prices have already run up materially in 2025 and many quality mid-caps are fairly priced. Without further improvement in fundamentals, it is unclear what the next upside catalyst will be.Macro positioning.
Singapore remains a beneficiary of “China+1” supply‑chain reconfiguration and regional wealth‑management flows. Local banks’ fee income and assets under management continue to be underpinned by this positioning, even if net interest margins stabilise rather than expand.Improving sentiment toward ASEAN.
As long as global investors remain underweight ASEAN relative to its economic footprint, Singapore will attract some share of regional inflows simply by virtue of its governance strength and currency stability.
Set against this, the 2025 rally also has several fragility points:
Concentration risk at the top.
With five stocks delivering about 75% of the STI’s gains and the top 10 companies making up over half of market cap, any disappointment in DBS, Singtel or ST Engineering will disproportionately affect index‑level performance. For allocators who bought Singapore as a “beta” trade in 2025, this concentration is effectively a bet on a few select names.Limited fundamental catch‑up.
Valuation multiples have expanded more quickly than earnings for many names. If earnings growth continues to underwhelm or global rates remain higher for longer, 2025’s multiple expansion could just as quickly reverse, particularly in cyclicals and turnaround names where the narrative has run ahead of the numbers.Structural quality gap.
The underlying market remains bimodal: roughly 170 high‑quality counters (less than 1/3 of total counters) carry two‑thirds of market cap, while a long tail of low‑quality or loss‑making names continues to dilute overall market perception. Catalist in particular, still looks more like a graveyard than a growth board in aggregate. Unless listing quality, governance and free‑float issues are addressed, global institutions will continue to treat SGX as a narrow large‑cap and REITs market, regardless of headline reforms.Liquidity’s double‑edged sword.
The same liquidity that amplified 2025’s rally can accelerate corrections. The 21% jump in daily turnover and 52% surge in small‑/mid‑cap liquidity are welcome, but flows can reverse quickly if global risk appetite shifts or if Singapore is seen as having “had its run”.
For 2026, three practical signposts stand out:
Earnings versus multiples. Do 2025’s price gains get validated by 2026 earnings growth and dividend increases?
Breadth of participation. Does performance broaden beyond the top 5–10 names into a wider swathe of high-quality and mid-tier companies, or does concentration intensify further?
Market‑quality metrics. Do the proportions of profitable, high quality listed companies and Catalist loss‑makers improve, or does the structural picture remain static?
If 2025’s rally is followed by earnings catch‑up and improving breadth, it will look like the start of a genuine re-rating of Singapore equities. If, instead, 2025 proves to be a one‑off liquidity‑and‑rotation spike on an unchanged fundamental base, boards and policymakers should treat it as a temporary window to fix underlying weaknesses; strengthening balance sheets, improving governance and addressing listing‑quality issues while valuations and liquidity are still supportive, rather than as a vindication that the market’s structural problems have been solved.
Written by:
Lee Ooi Keong
30 January 2026
Brief bio: Lee Ooi Keong is an Independent Director of a SGX Mainboard-listed company with 30-years of experience in corporate performance, investments and risk management. He is also the founder and MD of Clover Point Consultants – an independent Board and C-Suite advisory firm. Ooi Keong was also formerly a Director of Risk Management in Temasek for over 16 years.